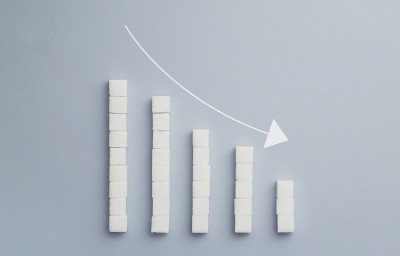
Soft drink sugar drops by 29% in the UK
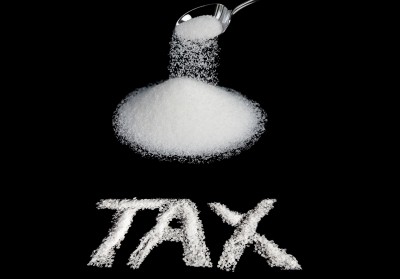
Published in BMC Medicine, the study notes that there has been considerable pressure on the industry to reduce sugar in soft drinks - including the introduction of a sugar tax (the Soft Drinks Industry Levy or SDIL) in April 2018.
The two biggest companies, Coca-Cola and Britvic, have reduced the overall quantity of sugars in drinks they sell by 17% and 26% respectively (although the sugar content of flagship brands Coca-Cola and Pepsi remained unchanged).
Meanwhile, six of the top 10 soft drinks companies in the UK have reformulated 50% or more of their products subject to the sugar tax.
More than 7,000 products assessed
The researchers undertook an annual cross-sectional study using nutrient composition data for 7,377 products, alongside volume sales data for 195 brands offered by 57 companies.
They found that, between 2015 and 2018, the volume of sugars sold per capita per day from soft drinks declined by 30%, equivalent to a reduction of 4.6g per capita per day. (This was against a backdrop of an increased in total volumes sales of soft drinks of 5%).
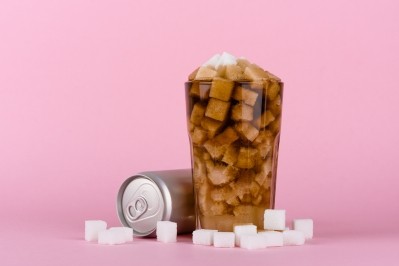
The average sugar content of soft drinks fell from 4.4 g/100 ml in 2015 to 2.9 g/100 ml in 2018.
Over the four year period, the total volume sales of soft drinks that are subject to the SDIL (those that contain more than 5 g/100 ml of sugar and thus deemed 'high sugar' in the study) fell by 50%. Volume sales of low- and zero-sugar (< 5 g/100 ml) drinks, meanwhile, rose by 40%.
“Action by the soft drinks industry to reduce sugar in products and change their product portfolios, coupled with changes in consumer purchasing, has led to a significant reduction in the total volume and per capita sales of sugars sold in soft drinks in the UK,” write the researchers.
Products with more than 5g sugar /100ml are taxed at 18p per litre; those with more than 8g sugar / 100ml are taxed at 24p per litre.
Pure fruit juice and flavoured milk drinks are exempt.
“The rate of change accelerated between 2017 and 2018, which also implies that the implementation of the SDIL acted as an extra incentive for companies to reformulate above and beyond what was already being done as part of voluntary commitments to reformulation, or changes in sales driven by consumer preferences.”
High sugar, mid sugar and zero sugar ranges
The researchers drew on Euromonitor data to identify soft drinks manufacturers and brands; alongside product-level nutrient data from analytics company Brand View.
It found that total volume sales of high and mid sugar soft drinks (ie those with more than 5g of sugar per 100ml) fell from 31% in 2015 to 15% in 2018 – equivalent to 106ml per person per day in 2015 to 50ml per person per day in 2018.
The combined low- and zero-sugar category (drinks under 5g sugar per 100ml), meanwhile, increased from 43 to 48%. The total volume sales of bottled water and products exempt from the SDIL rose by 23%.
2015: volume sales (million litres) | 2018: volume sales (million litres) | |
High-sugar (> 8 g/100 ml) | 66 | 39 |
Mid-sugar (5–8 g/100 ml) | 40 | 11 |
Low-sugar (0.1–5 g/100 ml) | 98 | 138 |
Zero-sugar (< 0.1 g/100 ml) | 52 | 74 |
Exempt products | 33 | 31 |
Bottled water | 62 | 75 |
There was a decrease in the total volume sales of sugars for eight of the top ten companies (defined by their total contribution to total volume sales of sugars).
The largest soft drinks company in terms of total volume sales of sugars in all four years was Coca-Cola; volume sales increased while the sugar content of products fell, leading to a 17% decrease in the total volume of sugars sold over time.
The authors warn the study is not intended as an assessment of the impact of the SDIL: but note that the rate of change ‘seems to have been accelerated by the announcement of the SDIL in March 2016 and its implementation in April 2018’.
The researchers therefore credit the SDIL for spurring reformulation efforts: finding that three-quarters (73%) of overall sugar reduction was as a result of reformulation or the introduction of new lower sugar drinks by manufacturers and retailers. Meanwhile, 27% was due to changes in purchasing behaviour.
“Some companies reformulated all products, while others chose to maintain the sugar content of key brands. There was no change in the sugar content of brands excluded from the SDIL. This evidence suggests that the implementation of the levy acted as an extra incentive for companies to reformulate above and beyond what was already being done as part of the voluntary or consumer driven reformulation.”
2015: total sugars (tonnes) | 2018: total sugar (tonnes) | |
Total volume sugar sold in drinks | 367,965 | 261,324 |
High-sugar (> 8 g/100 ml) | 170,541 (46%) | 102,553 (39%) |
Mid-sugar (5–8 g/100 ml) | 61,273 (17%) | 13,948 (5%) |
Low-sugar (0.1–5 g/100 ml) | 58,739 (16%) | 72,894 (28%) |
Zero-sugar (< 0.1 g/100 ml) | 0 (0%) | 0 (0%) |
Exempt products | 77,411 (21%) | 71,927 (28%) |